Fitness HRV
Release Site for Fitness HRV Applications
Downloads
Artifacts versus Corrected
by Stuart Lynne
Overview
The DFA plot contains indications of errors in the RR data. Before the collected RR data is used it is processed using the algorithm described in the 2019 paper from Lipponen and Tarvainen “A robust algorithm for heart rate variability time series artefact correction using novel beat classification” addresses this problem making specific recommendations on finding and dealing with artifacts.
See: A robust algorithm for heart rate variability time series artefact correction using novel beat classification Lipponen
Artifact types
Errors in the RR data have three sources:
- actual artifacts
- errors in measurement - as measured by the heart rate monitor
- errors in transmission - data lost in transmission via Ant+ or BLE
This paper provides an overview of the main types of errors in the RR data.
See: Heart Rate Variability during Exercise: A Comparison of Artefact Correction Methods Giles and Draper
Presentation
Presenting the information on where and by how much the RR data has been corrected is problematic. We want to see how many times the RR data has been corrected, and we want to see how much the DFA A1 calculation has bee affected.
To do this we need to have two different statistics:
- Corrections - the actual location of each corrected artifact
- Artifact Totals - the total number of artifacts that have been corrected for each DFA A1 data point
In the DFA A1 plot we show the both corrections and artifact totals.
Corrected Data
These represent the actual corrected data. Each bar represents a single correction.
The corrected data is referred to as NN data, and data points that have changed from the equivalent RR data is marked as corrected.
The time of each corrected data point is displayed by a dark vertical bar at the bottom of the DFA plot.
Artifact Totals
The artifact totals represent the impact the total number of corrections in the previous two minutes for the DFA point at the time. A larger artifact total indicates a larger set of corrections was needed.
The DFA algorithm displays a single value that is derived from the previous two minutes of NN data and is updated every two seconds.
This means that a single corrected data point will affect sixty different DFA data points. And the two minutes of NN data may contain multiple corrected values. This is represented by the artifact total, and is the colored bars at the bottom of the DFA plot.
A single corrected data point will add artifact total bars for the next two minutes.
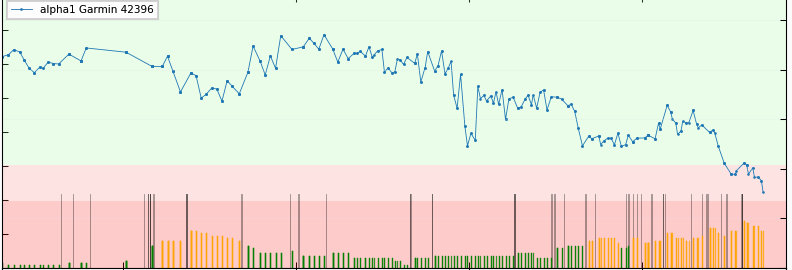
Interpreting the bars
- The black bars indicate actual corrected data.
- The color bars indicate the total number of corrections affecting the DFA A1 calulation.
Example: